Media Contact:
Melissa Troutman, 202.887.1872×132, mtroutman@earthworks.org
[Pittsburgh, PA] A new report by Earthworks documents a massive 1,500 percent increase in the volume of toxic, often radioactive waste generated by Pennsylvania oil and gas operations between 2003 and 2018. Earthworks calculates that in 2018 alone, the fracking boom generated 69 million barrels of liquid waste and 1.4 million tons of solid waste, a 20 percent increase in liquid and 35 percent increase in solid waste from 2017.
“How much of that fracking waste is coming to a facility near you?” asks Melissa Troutman, author of the PA Frack Waste report. “The Pennsylvania Oil and Gas Waste Map gives anyone access to information on the 380 billion of barrels of liquid waste and 9.5 million tons of solid waste sent to landfills, injection wells, and public facilities in Pennsylvania, West Virginia, Ohio and New York since 2011.”
The new online map identifies more than 1,100 sites processing fracking waste in multiple states and allows citizens to see the amount of waste taken each year at facilities near their home or school and disposed of in their watershed. Most of this waste is also transported on public roads.
“On Friday, August 23, a tanker truck carrying wastewater crashed and spilled in Elizabeth, PA, near the Youghiogheny River,” said Troutman. “The fracking boom put almost 15,000 of these tanker trucks on our roads in 2018, and that number is increasing by the year.”
The new report is based on a comprehensive review of oil and gas waste data that is sent to the state by oil and gas companies as well as the municipal and private waste disposal facilities that receive liquid and solid fracking waste. Earthworks also documents that fracking waste contains carcinogens, secret fracking chemicals, heavy metals, and radioactive materials.
Case studies in the report show how regulatory loopholes exempt the industry from hazardous waste laws and hide the ingredients in fracking waste, which makes treatment and disposal of this dangerous waste difficult. Testing and reporting, where it does happen, can be inaccurate.
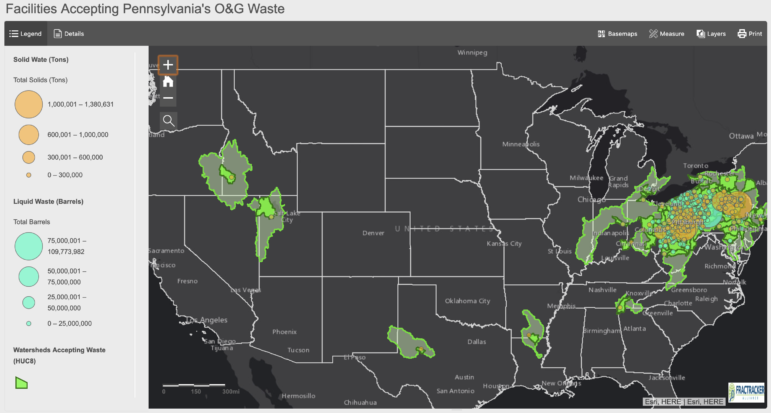 Using the Waste Map: Earthworks and FracTracker Alliance created the interactive Pennsylvania Oil & Gas Waste Map using PA DEP (Department of Environmental Protection) data to allow users to search and see how much oil and gas waste is being processed, transported, and disposed near them each year since 2011.
- Zoom the map to your home, school, business, etc. by clicking the magnifying glass under the zoom tool and typing a street address.
- Click on specific individual dots on the map to see the amount of waste a facility near you has accepted from PA oil and gas operations between 2011-2018.
- Click inside a watershed boundary to show how much oil and gas waste is being processed and disposed of in your watershed.